FM21: Analysts; What do they do?
On Football Manager 2021, analysts have been changed. FM21 introduced a new analyst, responsible for making raw data digestible and informative. On previous versions of Football Manager, they have been simply called Data Analysts. On Football Manager 2021, the 'Data Analysts' have been split into two roles: Recruitment Analysts and Performance Analysts.
What are Recruitment Analysts in Football Manager?
The Recruitment Analysts on Football Manager, form part of the Recruitment Team. This will consist of a Director of Football, Technical Director, Chief Scout, Scouts and Loan Manager (it should be noted that not all clubs will have all roles available).
The Recruitment Analysts assess the data that scouts provide, looking for key metrics that might help the club, highlighting any potential alarm bells before signing your next star.
The key attributes to look for when recruiting, are analysing data and judging player ability. Additional attributes to look for include determination, motivation and adaptability.
What is a Performance Analyst in Football Manager?
Clubs might have the luxury of having a Head Performance Analyst as well as numerous Performance Analysts. The Performance Analyst forms part of a vital team that should include your Assistant Manager and Coaches. Your coaches will look to develop your club's players working on both tactical and technical aspects of their game. The performance analysts analyse an abundance of data to discover how effective your team’s performance is. The tasks for the Performance Analysts is to represent the data that they assess visually. They provide data on the following: your teams' overall performance, individual player performances, opposition performances.
In a nut shell, the performance analysts will be the staff member to turn to when you want to look closer at general team performance in order to pick out any weaknesses that need rectifying; analysing individual player performance in line with their influence on the tactical style that you use; review data from the opposition in an effort to exploit their weaknesses; review match analysis in order to make effective tactical tweaks during matches.
Key attributes to look for when recruiting performance analysts include:
- Analysing data which allows an analyst to comprehend player or team data and interpret that data in a way that will support your decision making.
- Tactical knowledge - this links to the experience level of the analyst and depends on who they have previously worked with. If they have worked with experience tactical managers then the analyst knowledge of tactics will be superior compare to an analyst that has not.
As previously stated, additional attributes to look for include determination, motivation and adaptability.
Performance Analyst Reports
Below will be a list of reports that a Performance Analyst will provide on Football Manager.
General Team Reports
Under the analyst report tab on Football Manager you'll be greeted with an analytical report of how well your team has been performing compared to other teams in the competitions that your team is participating in.
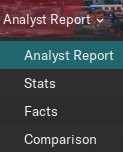
As can be seen in the image above, in the analyst report tab you have four options:
- Analyst Report
- Stats
- Facts
- Comparison
In the analyst report is split into five sections: General Performance, Scoring, Conceding, Formations and Previous Match Analysis
General Performance
Your performance analyst will provide a general overview of your team's performance. The following information will be provided:
- Team determination
- Team strengths
- Team weaknesses
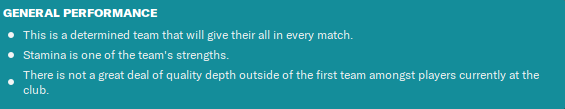
The image below is taken from a simulated Manchester United save on Football Manager 2021. The club's performance analyst has reported that the squad is very determined, that stamina is one of the team's strengths. In terms of weaknesses the performance analysts has reported that there is no a great deal of depth outside of the first team.
This data can be used to guide your tactical, transfer and player development planning. For instance, with the analyst reporting that the squad has limited depth, I might need to look at recruiting play with more versatility or recruiting players for the U23s/U18s that will add depth to the first team squad.
Another report that the analyst will provide in the general performance assessment is displayed in the polygon below.
The polygon gives you a basic representation of your team's tactical performance relating to goal scored, goals conceded, completed passes and the expected goals (xG) for and against. The report gives you an overview of what is working well and what needs improvements.
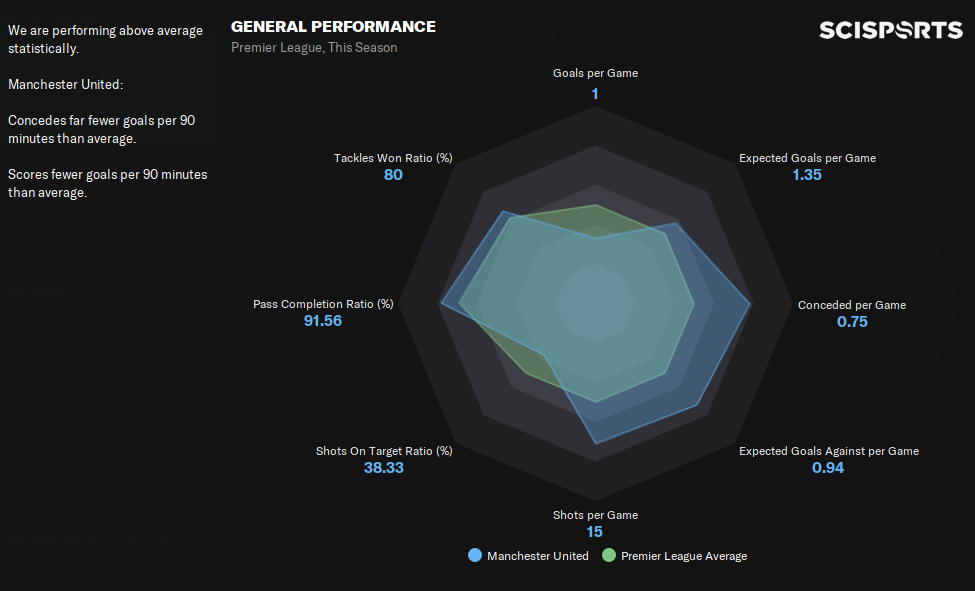
The polygon highlight key, compares the findings against the average analytical stats against the rest of the teams in the competition that you're analysing.
As can be seen in the polygon, the analyst has found that we're performing above average in the following section: Shots per game, xG goals against per game, conceded per game, xG per game, tackles won ratio, pass completion ratio. The polygon has also found that improvements are needed in the following areas as we're performing below average: shots on target ratio and goals per game.
In terms of making improvement and use of the data, as the team's manager you can make tactical changes based on the findings from the performance analyst. For instance the performance indicators that are below average (shots on target and goals per game) could be due to the lack of players in attacking positions, the quality of players etc. The findings should guide you to into making specific changes depending on the findings from the performance analyst.
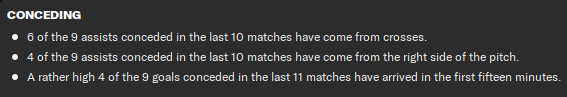
Scoring
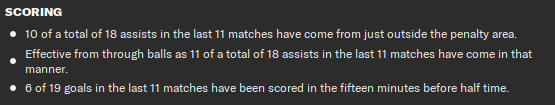
Above is a example of the information that the Performance Analyst will provide regarding your team's scoring performance. The information provided will look at where assists that have led to goals have come from, how effective assists have, when goals have been scored during games etc.
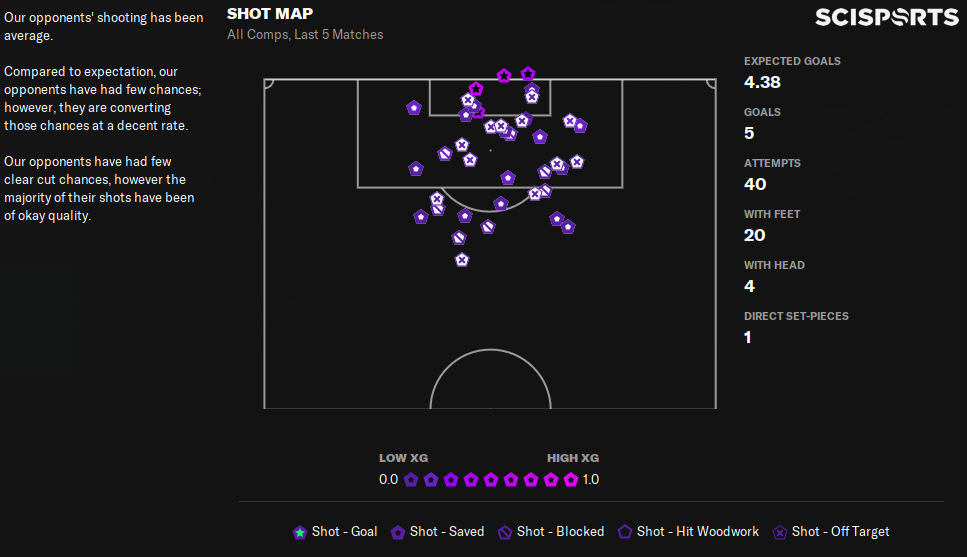
To get more of an idea on your team's shooting you can open the shot map which will give you more data on shots taken by your player in the last five games
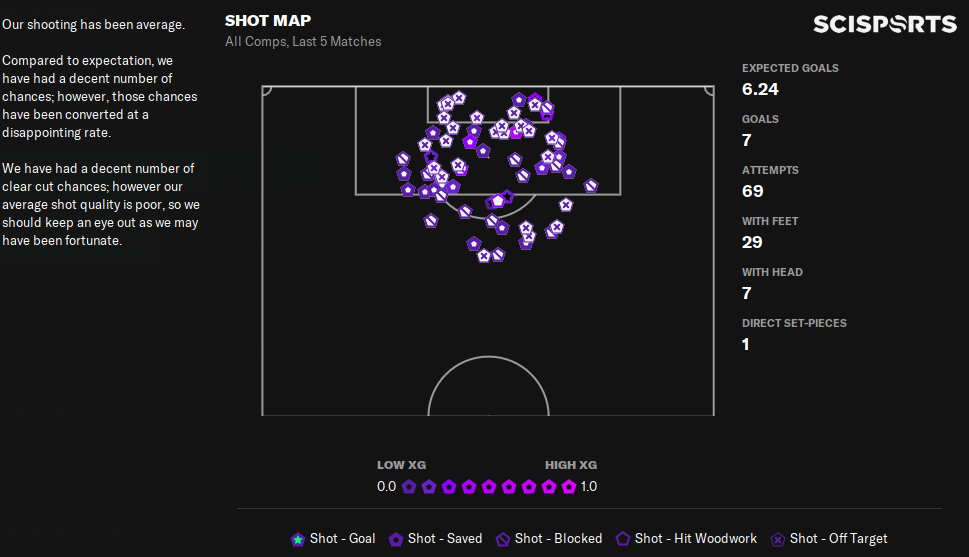
On the shot map, you'll be given a generic report regarding your team's shooting, conversion rate, clear cut chances etc. This information can be used to change tactical approaches whether that be player roles or whole team.
The shot map can be difficult to interpret if you've never looked at it before. Luckily there is a key and simple scrolling over a marker will highlight more information about that specific shot.
On the right side, you're giving numerical data about shooting including xG, goals, attempts, whether the shot was taken with feet, head or directly from a set piece.
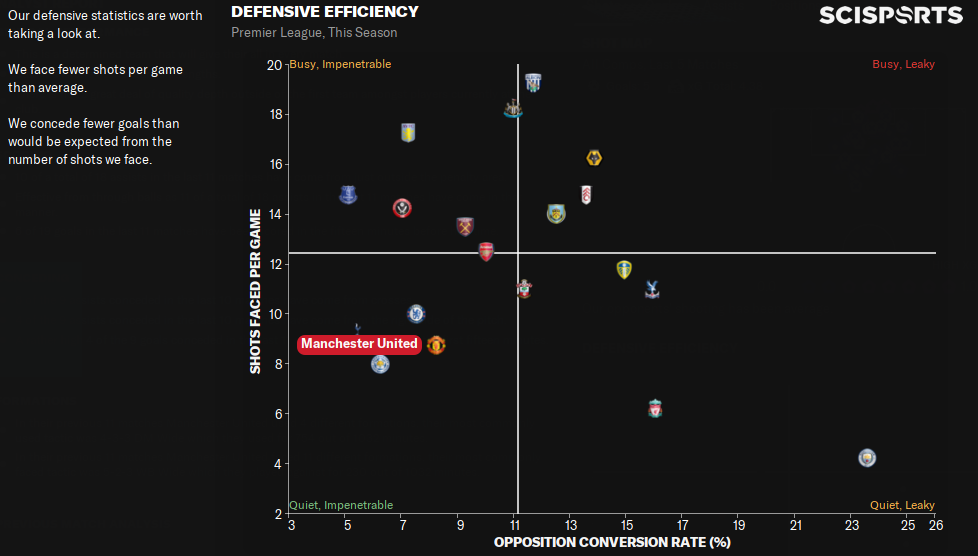
Below the shot map, your Performance Analyst will provide data on your attacking efficiency.
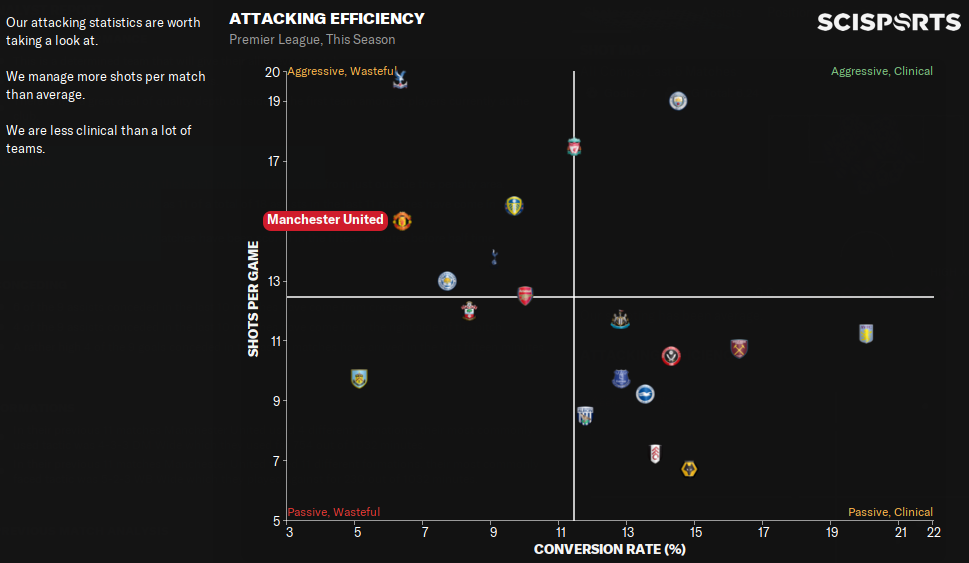
This data above can be difficult to interpret if you've not seen data presented in this way before. In order to understand it, all that you need to understand are the four sections of the data:
- Passive Wasteful
- Aggressive Wasteful
- Aggresive Clinical
- Passive Clinical
Understand the phrases above linked to the data presented above is what makes interpreting the data difficult. A passive activity involves watching, looking at, or listening to things rather than doing things. In footballing terms this seems to paint possession based football in a negative fashion. However, there is a reason that the phrases are split into passive and aggressive, wasteful and clinical. The latter phrases are easier to interpret. If players are wasteful with their shooting then they are mostly likely shooting from positions where they shouldn't be or shooting from positions where they should be scoring but not. In terms of being passive or aggressive. Shooting passively is defined by teams that take their team to build up to shooting opportunities. Shooting aggressively involves teams/players shooting from positions that are more risky compared to the positions that teams may shoot from if they're assessed as being passive.
Additional data that can be shown in the scoring section include goals, assists and positions. Each section has its use and can be used to assess both player performance and tactical performance.
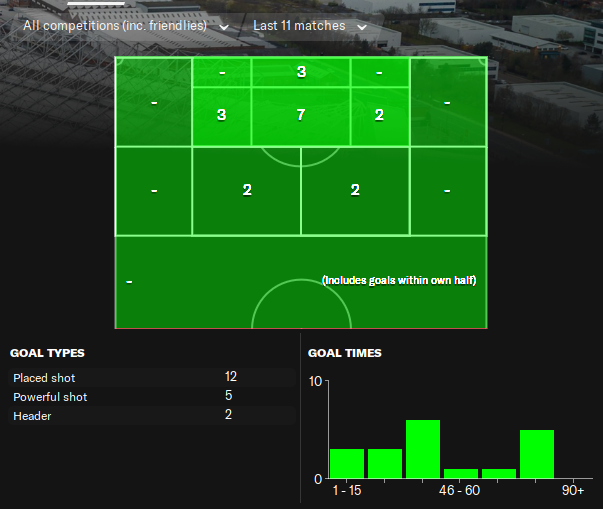
Above are a variety of graphics that the performance analyst will provide linked to goals scored by your team. The first pictographic shows where goals have been scored from. This data can help you assess what your team's build up play is like. For example, the data in the image above shows that the majority of goals have been scored inside the penalty area. The data goes into further detail splitting the penalty area into different sections showing that most goals have been scored from outside of the six-yard box. Goal types are also presented showing how goals have been scored as well as goal times. All of this data is useful and should be used to assess your team's performance.
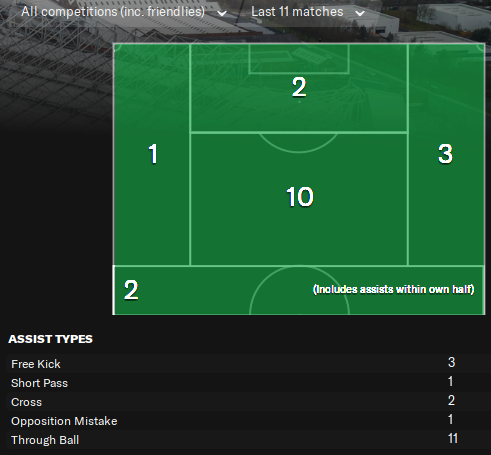
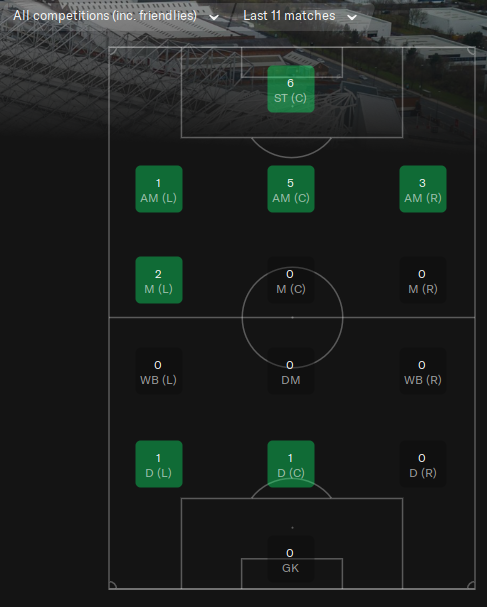
Assist data is an even better way to assess your team's performance. The visual data provided by the performance analyst shows where assists that have led to goals have come from on the pitch as well as showing the type of assist that it was.
The data provided on the position tab provides data on the positions that are scoring goals. This data, in my opinion seems like data with no actual purpose. However, it can be used to assess the players that you'd expect to be scoring goals.
Conceding
Moving on from the goals that your team scores to the goals that your team concedes. Your performance analyst will present data in the same way that the data is presenting in the scoring section. You'll be presented with a a shot map and graph that shows your team's defensive efficiency. The differences in the defensive efficiency graphs is in the titles of the axis (busy impenetrable, quiet impenetrable, busy leaky and quiet leaky). A busy defence faces more shots that a quiet defence. A leaky defence concedes more goals than an impenetrable defence table. What you should be targeting is a quiet, impenetrable defensive efficacy . The same tabs are shown show where goals have been conceded from, where opposition assists have come from and what positions from your opposition are scoring.
Formations
In the formations section, you'll receive an analysis of formations that you have used during matches and formations that your opposition have used. Below, you'll receive a basic report on the tactic based on it's effectiveness.
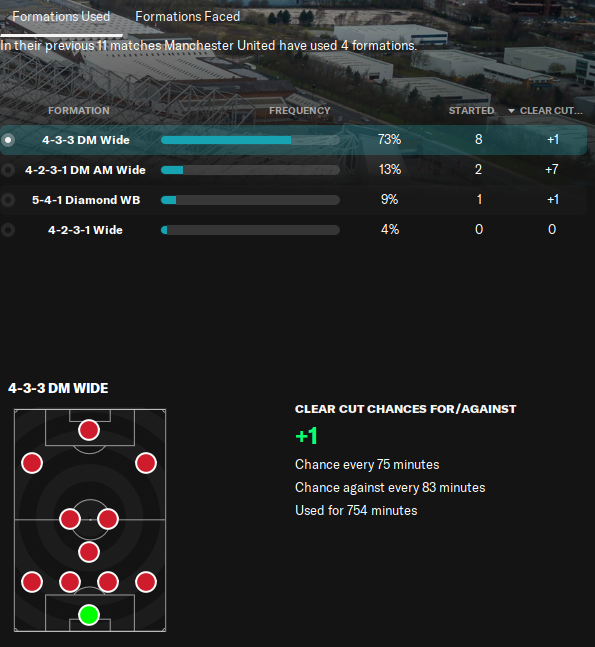
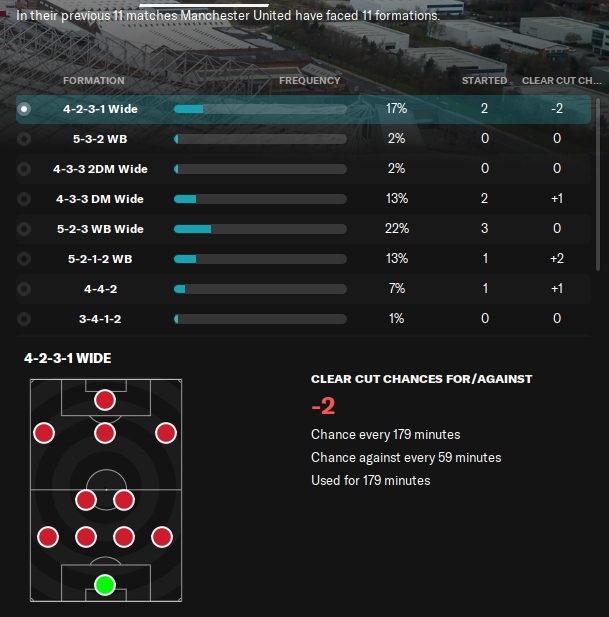
The data provided in this section allows you to assess which formations are working for your team. By comparing the tactics that your team scored more goals against or been able to create more chances, you will be able to reassess how effective your tactic is.
Player Reports
Your performance analyst will be able to provide individual player report after they have played a certain amount of minutes. The data will be presented in visually as a polygon with essential data representing key performance indicators. The feedback from the performance analyst provides you with a better picture of the standard of the player’s – whether they are performing at average, below average or far better than expected.
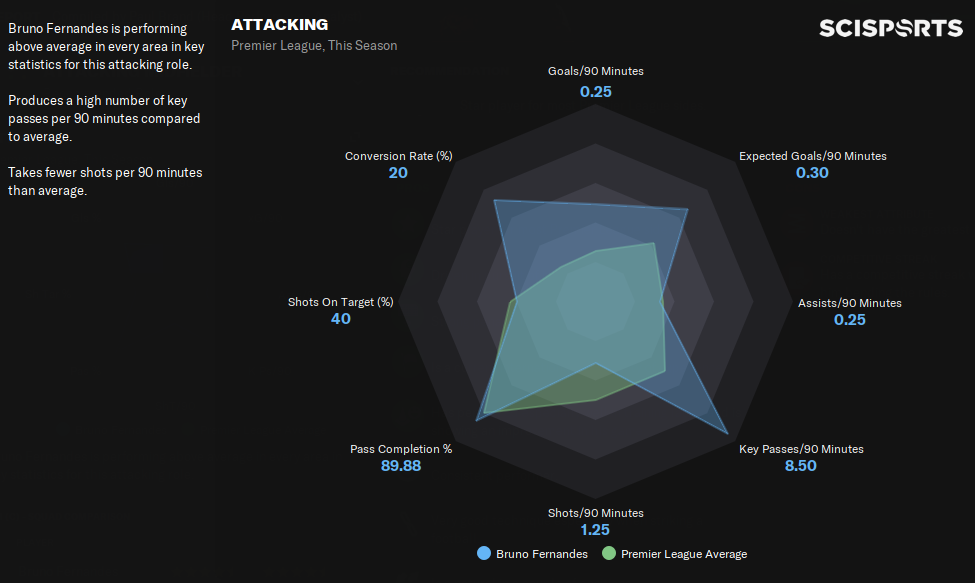
If you study the data effectively, you might comes to the conclusion that the player is not performing as expecting which will support you in making future individual player role, instruction and tactical decision. It might also guide your decision making in future transfer windows if you deem it necessary that you need a better player.
Opposition Team Analysis
Real life managers do not head into games without having assessed specific data about their opposition. The performance analyst provides a report about the next opposition which can be found via the following route:
Team Report > Next Opponent > Overview
The information provided in this report can be used to exploit opposition weaknesses. This is the first step into learning as much as possible about your opponent; their strength and what you can expect from them in the upcoming match.
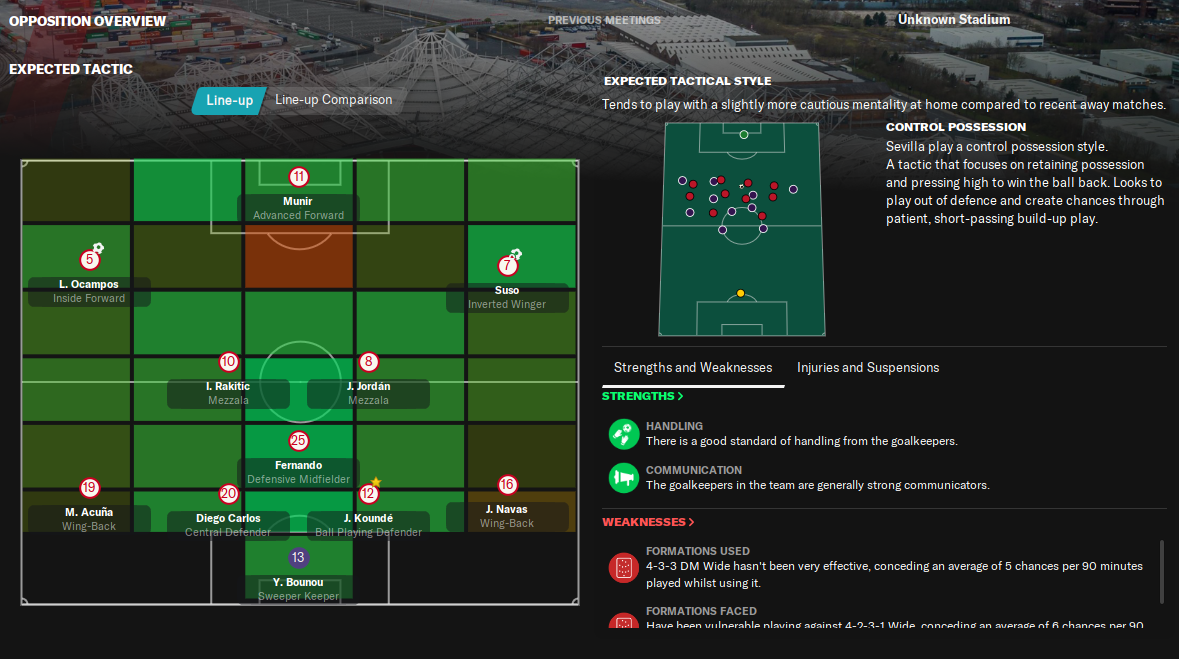
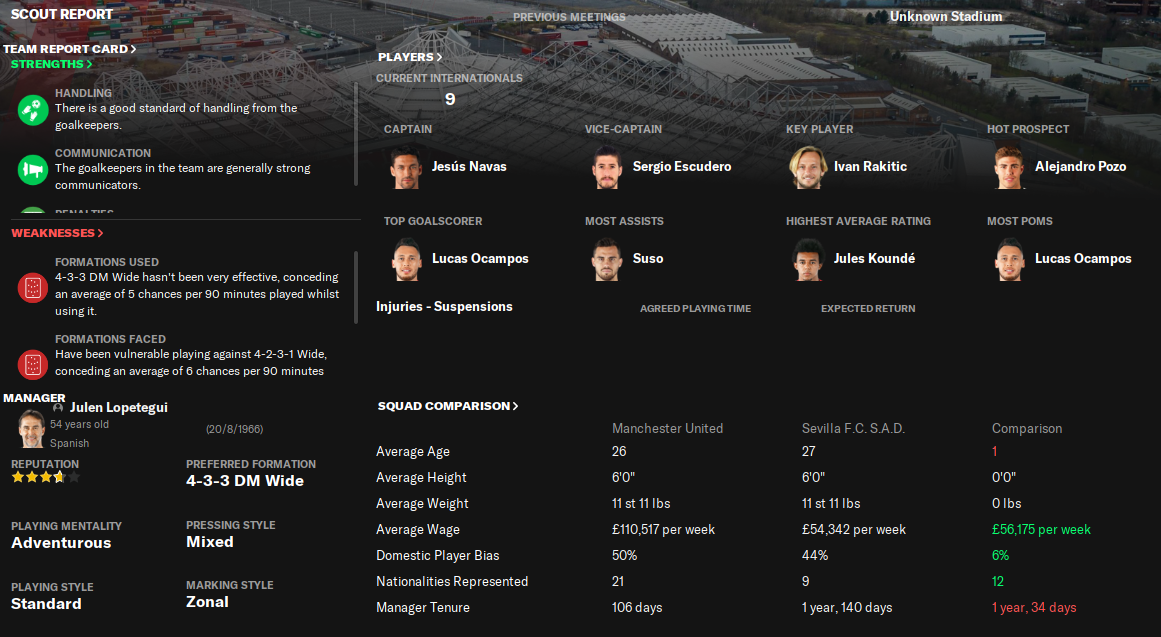
The Performance Analyst provides a detail report which can be found via this route: Team Report > Next Opponent > Scout Report
In report, you'll be able to see the potential mentality, formation, player roles and duties, preferred tactical style and line-up that your next opponent may use.
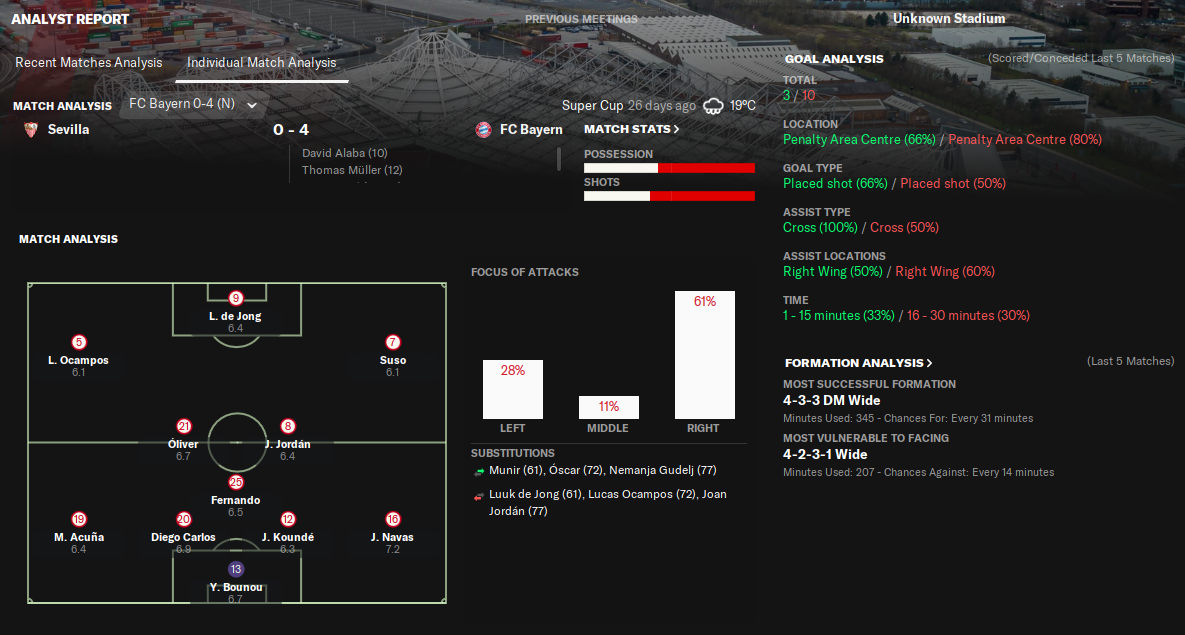
Match Analysis
The role of the Performance Analysis is also included before, during and after matches. During a match, the analysts will observe and assess the match statistics in order to calculate and provide reports in the form of xG plotted graphs.
The information provided by the Performance Analyst during games can guide you in your approach to team and individual player talks as well as guiding any potential changes that may need to be made during matches.
End of Season Report
At the end of each season, your performance analyst will provide you with a report of seasonal data. You'll be provided with a report assess how well your team performed against how your team were expected to perform. This report might help you to understand where you need to strengthen and improve for the upcoming season.
Conclusion
Utilising and interpreting the Performance Analyst's feedback is beneficial for a number of reasons.
The data that your Performance Analyst provides, should guide your decision making as the club's manager. The feedback lets you get more insight into how you can approach the next opponent, set up tactical game plans and adjust your tactics accordingly depending on the interpretation of the data provided.
I hope that this guide has been useful for. Football Manager is a very in-depth game that transcends a variety of facets. Using the plethora of data that is available on the game will guide you make the necessary decisions that will support you in your managerial conquests.
Buy Football Manager 2021
Click here to buy FM21